Ȩ > ±â¼ú¼³¸í > Áøµ¿
 
 
Áøµ¿ÀÇ ±âº» (º¯À§/¼Óµµ/°¡¼ÓµµÀÇ ¹°¸®Àû Á¤ÀÇ)

¡áBasic units used for vibration test

There are four important basic units for vibration test. They are Force [N], Acceleration [m/s 2 ], Velocity [m/s] and Displacement [mmp-p]. Let's start with the force. The force ¡°F¡± required to add acceleration ¡°A¡± to an object of mass ¡°m¡± is;

That is to say, when the acceleration of 1 [m/s 2 ] is applied to a mass of 1 [kg], the required force is 1 [N]. And gravity acceleration ¡°G¡± equals to 9.8 [m/s 2 ].

Assume here we have an object moving on sine wave. The displacement is;

The velocity is found by differentiation of the displacement. Therefore;

The acceleration is found by differentiation of the velocity. Therefore;

As we substitute

we obtain formulas indicated only in amplitude;

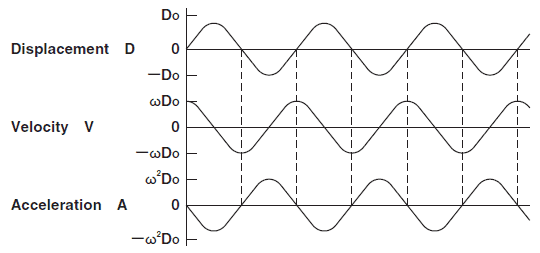
Followings are waveforms for displacement, velocity and acceleration.
We get below formulas by transforming above.
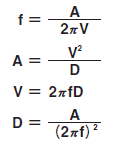
In vibration test field, we use ¡°d [ mmp-p ]¡± for the peak to peak displacement.
So all the above formulas are substituted by ¡°D = d / 2000¡±.

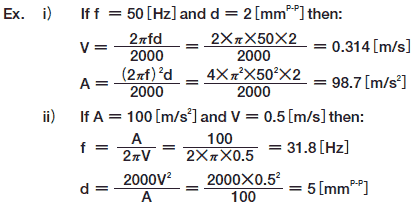
Let's try examples;

¡áAbout [dB]

We use ¡°dB¡± as a unit when we talk about physical proportion. Especially, in a case the value is thousands of times or millions of times multiple of a reference value, we use logarithmic scale ¡°dB¡± instead of linear scale. This is suitable for our sense and it is a proven fact. ¡°dB¡± is expressed as following:

One million times is:

Not only it reduces the digit number but also simplifies calculations.
For example, 25dB and 30dB makes 55dB but if you do it in a linear way;

It is very complicated like this. Now you see you can use addition instead of multiplication by using ¡°dB¡±. Followings are conversion tables for ¡°dB¡± and multiple.

dB 0 0.1 1 3 6 10 20 30 40 60
Multiple 1 1.01 1.12 1.41 2.0 3.16 10 31.6 100 1000

dB 0 -0.1 -1 -3 -6 -10 -20 -30 -40 -60
Multiple 1 0.99 0.891 0.709 0.501 0.316 0.1 0.0316 0.01 0.001

¡áPurpose of Logarithmic Graph

We often use logarithmic graph when we need to plot data for vibration testing or the other physical phenomenon. Let's see the same graph on linear graph and logarithmic graph.

On the linear graph, we can read 20 for Y when X is 100. But we can hardly read Y when X is 10 or 1. However on the logarithmic graph, we can read Y when X is 10 or 1 as 4.5 or 1. In fact, we can read the value even if it is 1/100 or 1/1000 of the maximum value. We use logarithmic graph for the purpose like this.

¡áGraph for Sine Waveform Test

We often use the graph like below when we execute sine waveform test. This is a double logarithmic graph that was learned before. Graphs that disp., vel. and acc. stay constant are there. Let's start with a graph of constant velocity. From the formulas we learned before;

Here we can read that acceleration A is enlarged 10 times when frequency f is enlarged 10 times. On the graph below, we see the acceleration turns to 100 m/s 2 from 10 m/s 2 as the frequency turns to 100 Hz from 10 Hz. In case of constant displacement;

Here we can read that acceleration A is enlarged 100 (10 2 ) times when frequency f is enlarged 10 times being proportioned to second power of f. On the graph below, we see the acceleration turns to 100 m/s 2 from 1 m/s 2 as the frequency turns to 10 Hz from 1 Hz.

That is to say, when velocity or displacement stays constant, inclination of graph is settled as indicated above.

Áøµ¿ÀÇ ÀÀ¿ë
ºü¸¥ ½ÃÀϳ»¿¡ ¿Ã¸®°Ú½À´Ï´Ù.


º»»ç : Ãæ³² ´çÁø½Ã ¼Û»ê¸é ¼Û»ê·Î 884-1

ÀüÈ­ : / 032-507-8771~2 Æѽº : 032-507-8773

Copyright@2006 Pinesys co.,Ltd.All right Reserved. mailto: mail@pinesys.co.kr_